
Why Haven't Stocks Declined More This Year?
On several occasions recently we have received the following question/comments from clients:
Why isn’t the market down much more than it is now? I don’t understand it. Economic activity has essentially stopped, 26 million Americans are unemployed, the world is on lock down with no end in sight and the market is down what 10% - 12%? It doesn’t make any sense!
I do believe the government’s response to the pandemic through the massive stimulus packages has had a meaningful impact and has helped to offset at least a portion of the economic slide and stock market slide. However, I would like to take a closer look at the actual depth of stock declines.
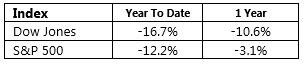
First, here are the short term performance numbers for the Dow and the S&P 500 Index (through 4/24/20):
What is “the market?”
From the table above, I would agree that the Dow and the S&P 500 have fared pretty favorably given the potential financial impact of the pandemic. However, I would point out that the Dow and the S&P 500 are not an accurate gauge of the overall stock market. This is due at least partially to the way these indexes are constructed. To give you an idea of what I mean, here is a general description of each index:
Dow Jones Industrial Average: The Dow is the most widely recognized and quoted index. Consisting of only 30 US headquartered stocks, it is generally considered the narrowest measure of market performance. The weighting of each stock in the index is based purely on each company’s stock price. In other words, the company with the highest stock price is weighted more heavily in the Dow than the company with the lowest stock price.
For example, Apple with a share price of about $290/share is the highest weighted stock in the Dow (at about 8%), while Pfizer with a share price of about $36/share is the lowest weighted stock (at about 1%).
S&P 500 Index: The S&P 500 is the most commonly referenced U.S. equity index and is comprised of the 500 largest U.S. companies. The S&P 500 is market capitalization weighted, meaning the largest companies constitute the heaviest weightings in the index. At present, the top 10 stocks in the S&P 500 represent a 25% weighting in the index, while the bottom 100 stocks represent less than a 10% weighting.
So obviously, the Dow and the S&P 500 are not true measures of the performance of stocks in comparison to a diversified portfolio. We all know that investors should have exposure to many different economic sectors and industries, sizes of companies, regions of the world, etc. Here are a few return numbers that can serve as a reminder that certain types of stocks have really been punished.
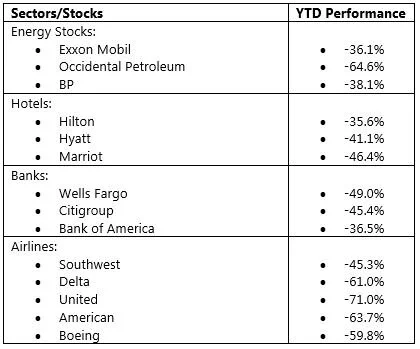
In addition to the many individual stocks that are down far in excess of the Dow or the S&P 500, there are indexes that track other segments of the stock market that have experienced substantial declines as well. Indexes that track small and mid-sized companies, as well as, international and emerging markets are down more than 20% (and some more than 30%!) on a year-to-date basis.
When looking at “the market” from a wider, more diversified lens than the largest 30 U.S. stocks, then you will see that stocks have taken quite a hit in the short term. While there has been some recovery since the March 23rd “bottom,” many stocks remain very close to their 2020 low point.
Can stocks decline further? Absolutely! However, those investors with a diversified portfolio who maintain a longer term time horizon will undoubtedly have the highest probability of capitalizing on the ultimate recovery.
Chip Hymiller, AIF®, CFP® is a principal and founder of Beacon Financial Strategies. Outside the office, he enjoys spending time with his family in the mountains and playing golf.
